How To Create Stacked Bar Chart In Laravel 9 Using Highcharts
Websolutionstuff | Dec-30-2022 | Categories : Laravel PHP jQuery
In this article, we will see how to create a dynamic stacked bar chart in laravel 9 using highchart. Here, we will learn highchart stacked bar column charts in laravel 7, laravel 8, and laravel 9. A stacked chart is a form of bar chart that shows the composition and comparison of a few variables, either relative or absolute, over time.
Also called a stacked bar or column chart, they look like a series of columns or bars that are stacked on top of each other. The stacked chart can represent either horizontally or vertically. You can install highcharts through npm and Bower. If you required npm or bower, prefer more npm or Bower respectively.
So, let's see the laravel 9 stacked bar chart, how to create a dynamic stacked bar chart in laravel 7/8/9 using highchart, and the column bar chart in laravel 9 using highchart.
Step 1: Install Laravel 9
Step 2: Create HighChartsController
Step 3: Add Route
Step 4: Create Blade File for Display Stacked Chart
Step 5: Add Script of Stacked Column Chart
In this step, we will install the laravel 9 application using the following command.
composer create-project laravel/laravel laravel-9-stacked-chart-hightcharts
Now, we will create HighchartsController and add the highChart() function.
app/Http/Controllers/HighchartsController
<?php

namespace App\Http\Controllers;

use Illuminate\Http\Request;

class HighchartsController extends Controller
{
    public function stackedHighChart()
    {

        return view('index', compact('stacked-chart'));

    }
}
In this step, we will add routes in the web.php file. So, add the following code to that file.
routes/web.php
use App\Http\Controllers\HighchartsController;

Route::get('highchart/stacked-chart', [HighchartsController::class, 'stackedHighChart']);
In this step, we will create a stacked-chart.blade.php file. Also, we will add CSS and jQuery and add the following code to that file.
resources/views/stacked-chart.blade.php
<html>
    <head>
        <style>
            #container {
                height: 400px;
            }

            .highcharts-figure,
            .highcharts-data-table table {
                min-width: 310px;
                max-width: 800px;
                margin: 1em auto;
            }

            .highcharts-data-table table {
                font-family: Verdana, sans-serif;
                border-collapse: collapse;
                border: 1px solid #ebebeb;
                margin: 10px auto;
                text-align: center;
                width: 100%;
                max-width: 500px;
            }

            .highcharts-data-table caption {
                padding: 1em 0;
                font-size: 1.2em;
                color: #555;
            }

            .highcharts-data-table th {
                font-weight: 600;
                padding: 0.5em;
            }

            .highcharts-data-table td,
            .highcharts-data-table th,
            .highcharts-data-table caption {
                padding: 0.5em;
            }

            .highcharts-data-table thead tr,
            .highcharts-data-table tr:nth-child(even) {
                background: #f8f8f8;
            }

            .highcharts-data-table tr:hover {
                background: #f1f7ff;
            }
        </style>
    </head>
    <title>How To Create Stacked Bar Chart In Laravel 9 Using Highcharts - Websolutionstuff</title>
    <body>
        <div id="container"></div>
    </body>
</html>
Now, we will use the Highcharts() function to display stacked column or bar charts. So, add the script in the <head> tag or at the bottom of the HTML tag.
<script src="https://code.highcharts.com/highcharts.js"></script>
<script src="https://code.highcharts.com/modules/exporting.js"></script>
<script src="https://code.highcharts.com/modules/export-data.js"></script>
<script src="https://code.highcharts.com/modules/accessibility.js"></script>
<script>
$(document).ready(function(){
Highcharts.chart('container', {
chart: {
type: 'column'
},
title: {
text: 'How To Create Stacked Bar Chart In Laravel 9 Using Highcharts',
align: 'center'
},
xAxis: {
categories: ['Arsenal', 'Chelsea', 'Liverpool', 'Manchester United']
},
yAxis: {
min: 0,
title: {
text: 'Count trophies'
},
stackLabels: {
enabled: true,
style: {
fontWeight: 'bold',
color: ( // theme
Highcharts.defaultOptions.title.style &&
Highcharts.defaultOptions.title.style.color
) || 'gray',
textOutline: 'none'
}
}
},
legend: {
align: 'left',
x: 70,
verticalAlign: 'top',
y: 70,
floating: true,
backgroundColor:
Highcharts.defaultOptions.legend.backgroundColor || 'white',
borderColor: '#CCC',
borderWidth: 1,
shadow: false
},
tooltip: {
headerFormat: '<b>{point.x}</b><br/>',
pointFormat: '{series.name}: {point.y}<br/>Total: {point.stackTotal}'
},
plotOptions: {
column: {
stacking: 'normal',
dataLabels: {
enabled: true
}
}
},
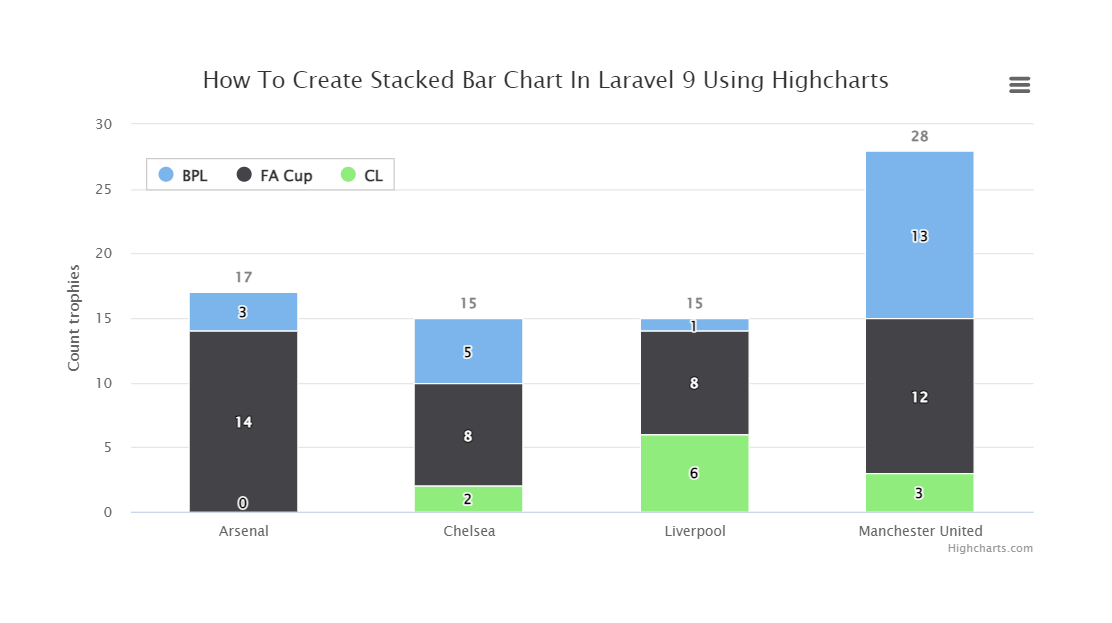
series: [{
name: 'BPL',
data: [3, 5, 1, 13]
}, {
name: 'FA Cup',
data: [14, 8, 8, 12]
}, {
name: 'CL',
data: [0, 2, 6, 3]
}]
});
});
</script>
Output:
You might also like:
- Read Also: Laravel 8 Google Bar Chart Example
- Read Also: How To Create Dynamic Bar Chart In Laravel 9
- Read Also: How To Implement Google Bar Chart In Vue Js
- Read Also: How To Create Line Chart In Laravel 9 Using Highcharts
Recommended Post
Featured Post

How to Create Form Request Val...
Hey there! Today, I want to talk to you about a super useful feature in Laravel 10 called form request validation. If yo...
Feb-23-2024

Mastering Reactive Forms Valid...
Welcome to "Mastering Reactive Forms Validation in Angular 15: A Comprehensive Guide." In this guide, we will...
Jun-14-2023

How to Install PHP DOM Extensi...
In this tutorial, I will guide you through the process of installing the PHP DOM Extension in Ubuntu 23.04. The PHP DOM...
Jan-29-2024

How To Validate Max File Size...
This article will show us how to validate max file size using javascript. Many times we have a requirement to check...
Aug-03-2020