How To Create Dynamic Pie Chart In Laravel
Websolutionstuff | Jun-24-2020 | Categories : Laravel PHP jQuery
In this article, we will see how to create a dynamic pie chart in laravel. charts are used to represent data in graphics view, for the creation of a dynamic pie chart example you need to create a route, controller, blade file, and database. So, if you will follow this tutorial step by step then definitely you will get output.
So, let's see a dynamic pie chart in laravel 6 and laravel 7 or a dynamic pie chart example.
Type the following command in the terminal.
composer create-project --prefer-dist laravel/laravel echart
We need dynamic data for the pie chart example. So first, we have to create migration for the "product" table using the Laravel PHP artisan command. So, first type the below command.
php artisan make:migration create_products_table --create=products
After running this command you will find the PHP file here location "database/migrations/" in this file you need to add the below code.
<?php

use Illuminate\Database\Migrations\Migration;
use Illuminate\Database\Schema\Blueprint;
use Illuminate\Support\Facades\Schema;

class CreateProductTable extends Migration
{
    /**
     * Run the migrations.
     *
     * @return void
     */
    public function up()
    {
        Schema::create('product', function (Blueprint $table) {
            $table->id();
            $table->string('name')->nullable();
            $table->integer('price')->nullable();
            $table->integer('year')->nullable();
            $table->string('product_type')->nullable();
            $table->timestamps();
        });
    }

    /**
     * Reverse the migrations.
     *
     * @return void
     */
    public function down()
    {
        Schema::dropIfExists('product');
    }
}
after this, we need to run this migration by following the command in our terminal.
php artisan migrate
Now, Add route in Routes/web.php
Route::get('echarts', 'EchartController@echart');
After adding the route we need to create a new controller and model so type the below command to create a controller.
php artisan make:controller EchartController
php artisan make:model Product
Add the below code in the App\Http\Controllers\EchartController path.
<?php

namespace App\Http\Controllers;
use App\Product;
use Illuminate\Http\Request;

class EchartController extends Controller
{

    public function echart(Request $request)
    {
    	$fruit = Product::where('product_type','fruit')->get();
    	$veg = Product::where('product_type','vegitable')->get();
    	$grains = Product::where('product_type','grains')->get();
    	$fruit_count = count($fruit);
    	$veg_count = count($veg);
    	$grains_count = count($grains);
    	return view('echart',compact('fruit_count','veg_count','grains_count'));
    }
}
Now in this final step, we are creating an echart.blade.php file for view.
<!DOCTYPE html>
<html>
<head>
	<meta charset="utf-8">
	<meta http-equiv="X-UA-Compatible" content="IE=edge">
	<title>how to create dynamic pie chart in laravel - websolutionstuff.com</title>
	<link rel="stylesheet" href="https://maxcdn.bootstrapcdn.com/bootstrap/3.3.7/css/bootstrap.min.css">
	<link href="{{asset('assets/css/components.min.css')}}" rel="stylesheet" type="text/css">
	<script type="text/javascript" src="{{asset('assets/js/jquery.min.js')}}"></script>
	<script type="text/javascript" src="{{asset('assets/js/bootstrap.bundle.min.js')}}"></script>
	<script type="text/javascript" src="{{asset('assets/js/echarts.min.js')}}"></script>
</head>
<body>
<div class="col-md-12">
	<h1 class="text-center">how to create dynamic pie chart in laravel - websolutionstuff.com</h1>
	<div class="col-xl-6" style="margin-top: 30px;">
		<div class="card">
			<div class="card-body">
				<div class="chart-container">
					<div class="chart has-fixed-height" id="pie_basic"></div>
				</div>
			</div>
		</div>
	</div>
</div>
</body>
</html>
<script type="text/javascript">
var pie_basic_element = document.getElementById('pie_basic');
if (pie_basic_element) {
    var pie_basic = echarts.init(pie_basic_element);
    pie_basic.setOption({
        color: [
            '#2ec7c9','#b6a2de','#5ab1ef','#ffb980','#d87a80',
            '#8d98b3','#e5cf0d','#97b552','#95706d','#dc69aa',
            '#07a2a4','#9a7fd1','#588dd5','#f5994e','#c05050',
            '#59678c','#c9ab00','#7eb00a','#6f5553','#c14089'
        ],

        textStyle: {
            fontFamily: 'Roboto, Arial, Verdana, sans-serif',
            fontSize: 13
        },

        title: {
            text: 'Pie Chart Example',
            left: 'center',
            textStyle: {
                fontSize: 17,
                fontWeight: 500
            },
            subtextStyle: {
                fontSize: 12
            }
        },

        tooltip: {
            trigger: 'item',
            backgroundColor: 'rgba(0,0,0,0.75)',
            padding: [10, 15],
            textStyle: {
                fontSize: 13,
                fontFamily: 'Roboto, sans-serif'
            },
            formatter: "{a} <br/>{b}: {c} ({d}%)"
        },

        legend: {
            orient: 'horizontal',
            bottom: '0%',
            left: 'center',
            data: ['Fruit', 'Vegitable','Grains'],
            itemHeight: 8,
            itemWidth: 8
        },

        series: [{
            name: 'Product Type',
            type: 'pie',
            radius: '70%',
            center: ['50%', '50%'],
            itemStyle: {
                normal: {
                    borderWidth: 1,
                    borderColor: '#fff'
                }
            },
            data: [
                {value: {{$fruit_count}}, name: 'Fruit'},
                {value: {{$veg_count}}, name: 'Vegitable'},
                {value: {{$grains_count}}, name: 'Grains'}
            ]
        }]
    });
}
</script>
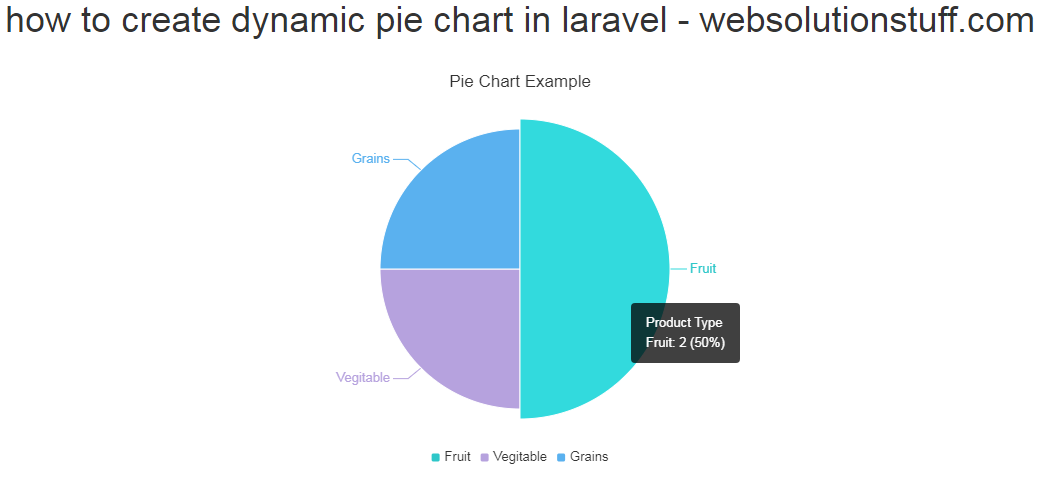
So, We are done with our code and you can see the output as below screen print.
You might also like:
- Read Also: Laravel 8 Google Bar Chart Example
- Read Also: Laravel 8 Highcharts Example Tutorial
- Read Also: Google Line Chart Example in Laravel 8
- Read Also: How To Implement Google Bar Chart In Vue Js
Recommended Post
Featured Post

What Is New In Laravel 9 - Fea...
In this article, we will see what is new in laravel 9 and the features of laravel 9. Laravel 9 is recently released...
Feb-13-2022

How to Create Newsletter in La...
Hey there! In this article, I'm thrilled to guide you through the exciting world of creating newsletters in Laravel...
Nov-29-2023

Pagination Example In Laravel
In this article, we will see a pagination example in laravel, as we all know pagination is a very common feature in all...
Sep-24-2020

How To Add Default Value Of Co...
In this article, we will explore how to add default values to columns in Laravel 10 migrations, although the information...
May-01-2023