How To Create Dynamic Pie Chart In Laravel 8
Websolutionstuff | Oct-02-2020 | Categories : Laravel jQuery
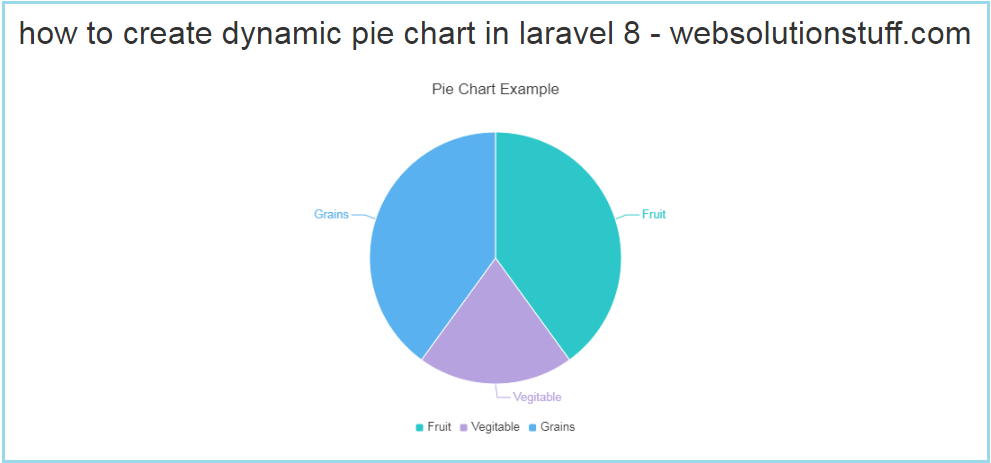
In this article, we will see how to create a dynamic pie chart in laravel 8. Pie charts are used to represent data in graphics view. For the creation of a dynamic pie chart example, you need to create a model, controller, route, blade file, and database. So, follow step by step then definatly you will get the output of a dynamic pie chart example.
So, let's see the pie chart in laravel 8 and dynamic charts in laravel.
Laravel 8 Dynamic Pie Chart Example
Type the below command in your terminal to create a new project of the dynamic pie chart.
composer create-project --prefer-dist laravel/laravel echart
We need dynamic data for the pie chart example. So first, we have to create migration for the "product" table using the laravel php artisan command.
php artisan make:migration create_products_table --create=products
After running this command you will find the php file "database/migrations/".
<?php

use Illuminate\Database\Migrations\Migration;
use Illuminate\Database\Schema\Blueprint;
use Illuminate\Support\Facades\Schema;

class CreateProductsTable extends Migration
{
    /**
     * Run the migrations.
     *
     * @return void
     */
    public function up()
    {
        Schema::create('products', function (Blueprint $table) {
            $table->id();
            $table->string('name')->nullable();
            $table->integer('price')->nullable();
            $table->integer('year')->nullable();
            $table->string('product_type')->nullable();
            $table->timestamps();
        });
    }

    /**
     * Reverse the migrations.
     *
     * @return void
     */
    public function down()
    {
        Schema::dropIfExists('products');
    }
}
After this, we need to run this migration by following the command in our terminal.
php artisan migrate
Now add a route in the web.php file.
routes/web.php
<?php

use Illuminate\Support\Facades\Route;

Route::get('/', function () {
    return view('welcome');
});

Route::get('echarts', 'App\Http\Controllers\EchartController@echart');
After adding the route, we need to create a new controller and model for the pie chart example. So, type the below command to create a controller.
php artisan make:controller EchartController
php artisan make:model Product
Now, Add the below code in the Product Model file.
app\Models\Product.php
<?php

namespace App\Models;

use Illuminate\Database\Eloquent\Factories\HasFactory;
use Illuminate\Database\Eloquent\Model;

class Product extends Model
{
    use HasFactory;

    protected $table = 'products';
    protected $guarded = [];
}
Add the below code in the app\Http\Controllers\EchartController.php file.
<?php

namespace App\Http\Controllers;
use App\Models\Product;
use Illuminate\Http\Request;

class EchartController extends Controller
{
    public function echart(Request $request)
    {
    	$fruit = Product::where('product_type','fruit')->get();
    	$veg = Product::where('product_type','vegitable')->get();
    	$grains = Product::where('product_type','grains')->get();
    	$fruit_count = count($fruit);
    	$veg_count = count($veg);
    	$grains_count = count($grains);
    	return view('echart',compact('fruit_count','veg_count','grains_count'));
    }
}
Now, we are creating an echart.blade.php file for viewing.
<html>
<head>
	<meta charset="utf-8">
	<meta http-equiv="X-UA-Compatible" content="IE=edge">
	<title>how to create dynamic pie chart in laravel 8 - websolutionstuff.com</title>
	<link rel="stylesheet" href="https://maxcdn.bootstrapcdn.com/bootstrap/3.3.7/css/bootstrap.min.css">
	<link href="{{asset('assets/css/components.min.css')}}" rel="stylesheet" type="text/css">
	<script type="text/javascript" src="{{asset('assets/js/jquery.min.js')}}"></script>
	<script type="text/javascript" src="{{asset('assets/js/bootstrap.bundle.min.js')}}"></script>
	<script type="text/javascript" src="{{asset('assets/js/echarts.min.js')}}"></script>
</head>
<body>
<div class="col-md-12">
	<h1 class="text-center">how to create dynamic pie chart in laravel 8 - websolutionstuff.com</h1>
	<div class="col-xl-6" style="margin-top: 30px;">
		<div class="card">
			<div class="card-body">
				<div class="chart-container">
					<div class="chart has-fixed-height" id="pie_basic"></div>
				</div>
			</div>
		</div>
	</div>
</div>
</body>
</html>
<script type="text/javascript">
var pie_basic_element = document.getElementById('pie_basic');
if (pie_basic_element) {
    var pie_basic = echarts.init(pie_basic_element);
    pie_basic.setOption({
        color: [
            '#2ec7c9','#b6a2de','#5ab1ef','#ffb980','#d87a80',
            '#8d98b3','#e5cf0d','#97b552','#95706d','#dc69aa',
            '#07a2a4','#9a7fd1','#588dd5','#f5994e','#c05050',
            '#59678c','#c9ab00','#7eb00a','#6f5553','#c14089'
        ],

        textStyle: {
            fontFamily: 'Roboto, Arial, Verdana, sans-serif',
            fontSize: 13
        },

        title: {
            text: 'Pie Chart Example',
            left: 'center',
            textStyle: {
                fontSize: 17,
                fontWeight: 500
            },
            subtextStyle: {
                fontSize: 12
            }
        },

        tooltip: {
            trigger: 'item',
            backgroundColor: 'rgba(0,0,0,0.75)',
            padding: [10, 15],
            textStyle: {
                fontSize: 13,
                fontFamily: 'Roboto, sans-serif'
            },
            formatter: "{a} <br/>{b}: {c} ({d}%)"
        },

        legend: {
            orient: 'horizontal',
            bottom: '0%',
            left: 'center',
            data: ['Fruit', 'Vegitable','Grains'],
            itemHeight: 8,
            itemWidth: 8
        },

        series: [{
            name: 'Product Type',
            type: 'pie',
            radius: '70%',
            center: ['50%', '50%'],
            itemStyle: {
                normal: {
                    borderWidth: 1,
                    borderColor: '#fff'
                }
            },
            data: [
                {value: {{$fruit_count}}, name: 'Fruit'},
                {value: {{$veg_count}}, name: 'Vegitable'},
                {value: {{$grains_count}}, name: 'Grains'}
            ]
        }]
    });
}
</script>
Output:
You might also like:
- Read Also: Generate Dynamic Sitemap in Laravel
- Read Also: How To Create Dynamic Bar Chart In Laravel
- Read Also: How to Add and Delete Rows Dynamically using jQuery
- Read Also: How To Create Pie Chart In Laravel 9 Using Highcharts
Recommended Post
Featured Post

Laravel 8 Class NumberFormatte...
In this example we will see example of laravel 8 class numberformatter not found. For numberformatter we need PHP 5...
Dec-27-2021

How to Create Custom Login and...
In the ever-evolving landscape of web development, crafting a tailor-made user authentication system stands as a pivotal...
Aug-25-2023

Laravel 9 Socialite Login with...
In this article, we will see laravel 9 socialite login with a facebook account. Many websites provide different typ...
Apr-16-2022

How To Fixed Header In Datatab...
Data presentation and organization are easier with data tables. They help display information in an organized way. These...
Jan-05-2023